All-Time MLS Franchise Rankings, 2015 Edition
The opening kickoff of the 2015 Major League Soccer season is nearly upon us, and now that MLS is celebrating its 20th anniversary I think they’ve earned the honor of having their franchises ranked by yours truly.
For those unfamiliar with my other franchise rankings, the idea is simple. I come up with a point system for various categories for each team and do some simple math. Teams are then ranked according to average points earned per year, not total points.
The idea is to introduce some objectivity to the exercise, and also to allow teams that perform well but may not have a bunch of titles to be rewarded for that. Likewise, teams that win it all once or twice but otherwise stink are not unfairly rewarded. And this also allows for older franchises to not be able to just pile up points and take an insurmountable lead.
Note: As Chivas USA is no longer an active franchise, they are not included in these rankings. Likewise, obviously it’s too early to rank New York City FC or Orlando City SC.
For more rankings, check out my Sports Lists page.
The Criteria
The categories and point values are as follows:
- 25 points for an MLS Cup win, 15 points for a loss.
- 10 points for a Supporters’ Shield (best regular season record).
- 5 points for a conference title (division title for the 2000-01 seasons).
- 3 points for a postseason berth.
- 2 points for a playoff round win (not including knockout games).
- I apply a unique multiplier to a team’s average seasonal goal differential, rewarding franchises that have a higher number.
Feel free to share your thoughts on my rankings in the comments below. And check out my Sports Lists page for more franchise rankings.
All rankings here are as of the end of the 2014 MLS season. Although I did not publish a list for the 2013 season, I did the calculations and each team’s 2013 ranking is shown in parentheses.
The Best (1-6)
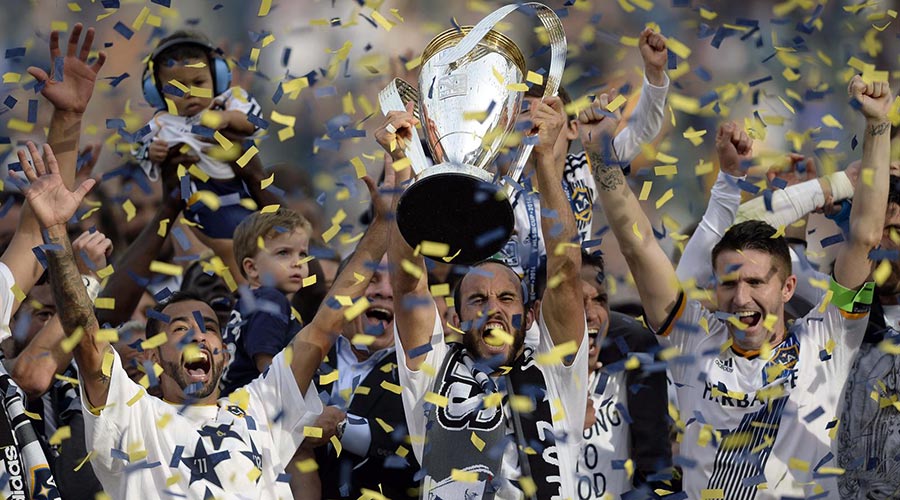
#1. Los Angeles Galaxy (#1) — 19.69 avg.
#2. Houston Dynamo (#2) — 15.00 avg.
#3. D.C. United (#3) — 12.89 avg.
#4. Seattle Sounders (#8) — 8.88 avg.
#5. Sporting Kansas City (#5) — 8.69 avg.
#6. Chicago Fire (#4) — 8.63 avg.
Middle of the Road (7-12)
#7. Real Salt Lake (#6) — 7.97 avg.
#8. San Jose Earthquakes (#7) — 7.32 avg.
#9. New England Revolution (#9) — 7.17 avg.
#10. Columbus Crew (#10) — 5.98 avg.
#11. New York Red Bulls (#12) — 4.82 avg.
#12. Colorado Rapids (#11) — 4.48 avg.
The Worst (13-18)
#13. FC Dallas (#13) — 3.07 avg.
#14. Portland Timbers (#14) — 2.50 avg.
#15. Vancouver Whitecaps (#17) — 0.00 avg.
#16. Philadelphia Union (#16) — -0.36 avg.
#17. Toronto FC (#18) — -2.95 avg.
#18. Montreal Impact (#15) — -3.17 avg.