Sports All-Time NBA Franchise Rankings, 2015-16 Edition by Chris Holmes October 18, 2015 The 2015-16 … Read the rest...
Sports What City and State Has Lost the Most Sports Teams? by Chris Holmes July 16, 2015 When we talk … Read the rest...
Featured Posts, Sports All-Time NBA Franchise Rankings, 2014 Edition by Chris Holmes October 29, 2014 The 2014-15 … Read the rest...
Ephemera, Sports This 1969-70 Sporting News NBA Guide Is Great by Chris Holmes June 2, 2014 Old sports m… Read the rest...
Blogstuff, Sports Introducing… The Press Room! by Chris Holmes January 10, 2014 This week I s… Read the rest...
Sports The Best and Worst NBA Logos (Pacific Division) by Chris Holmes November 12, 2013 I’ve gone th… Read the rest...
Sports The 10 Best NBA Franchises, 2013 Edition by Chris Holmes October 22, 2013 OK, I’… Read the rest...
Sports The 10 Worst NBA Franchises, 2013 Edition by Chris Holmes October 15, 2013 The 2013-14 … Read the rest...
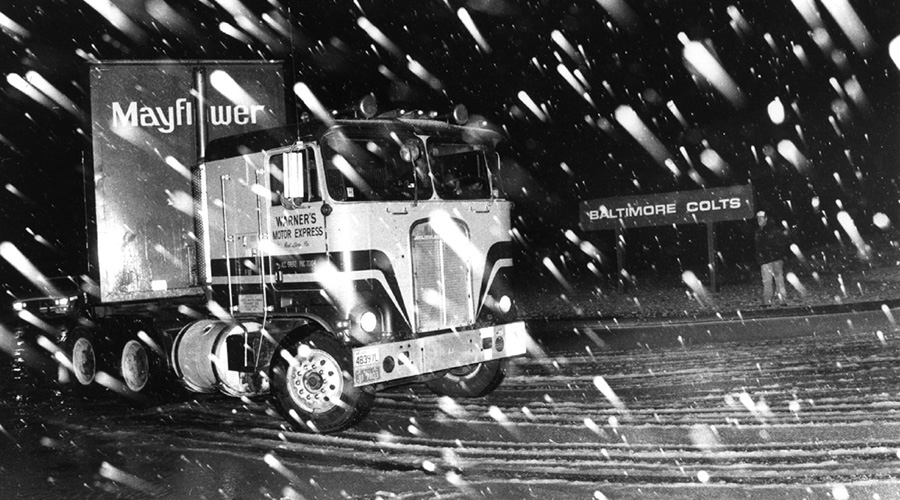
Retrotisements Ads from the Open Road, Volume 2: Phoenix Suns Billboards by Chris Holmes June 11, 2013 For this, th… Read the rest...